

How to Plot a World Map Using Python and GeoPandas
Learn how to plot maps of the world, continents, and countries using Python and GeoPandas.
Lately, I’ve been on a mission to wrap my head around the EM-DAT natural disaster dataset.
My exploration started with an introductory article on the EM-DAT dataset, and then followed up with a detailed explanation of the hierarchical structure in which EM-DAT is organized.
Through my exploration, I’ve been able to grok the basics of EM-DAT (and document my findings along the way).
However, while I was able to fully understand how EM-DAT classifies natural disasters, what I did not get from my exploration is an idea of the distribution of natural disaster types (i.e., “How many tornadoes vs. Hurricanes/tropical cyclones are included in the dataset?”).
This article picks up from where my previous study leaves off, and includes a detailed breakdown of the natural disaster types in EM-DAT.
Table of Contents
For the sake of simplicity and reproducibility, I am using the Kaggle-hosted version of the EM-DAT dataset, which is freely available to download and use.
If you instead use the official EM-DAT version from CRED (which requires registration), the results of running my code may look slightly different.
Kindly keep in mind potential result discrepancy when running your own experiments.
 Exploring natural disaster types (image credit)
If you haven’t yet, I suggest you read my previous article on the EM-DAT natural disaster type hierarchy to ensure you understand how the EM-DAT dataset is organized.
To explore the distributions of all possible natural disaster types in EM-DAT, we’ll create barchats that display counts for each natural disaster type.
An added benefit of this approach is that it also gives you an idea of the natural disasters most represented in EM-DAT.
To get started, I load the EM-DAT dataset from disk:
# import the necessary packages
import matplotlib.pyplot as plt
import seaborn as sns
import pandas as pd
import os

# specify the path to the EM-DAT dataset
emdat_dataset_path = os.path.join(
    "natural-disasters-data",
    "em-dat",
    "EMDAT_1900-2021_NatDis.csv"
)

# load the EM-DAT natural disasters dataset from disk
df = pd.read_csv(emdat_dataset_path)
df.head()
Here is a sample of the EM-DAT data:
| Dis No | Year | Seq | Disaster Group | Disaster Subgroup | Disaster Type | Disaster Subtype | Disaster Subsubtype | Event Name | Entry Criteria | Country | ISO | Region | Continent | Location | Origin | Associated Dis | Associated Dis2 | OFDA Response | Appeal | Declaration | Aid Contribution | Dis Mag Value | Dis Mag Scale | Latitude | Longitude | Local Time | River Basin | Start Year | Start Month | Start Day | End Year | End Month | End Day | Total Deaths | No Injured | No Affected | No Homeless | Total Affected | Reconstruction Costs ('000 US$) | Insured Damages ('000 US$) | Total Damages ('000 US$) | CPI | |
|---|---|---|---|---|---|---|---|---|---|---|---|---|---|---|---|---|---|---|---|---|---|---|---|---|---|---|---|---|---|---|---|---|---|---|---|---|---|---|---|---|---|---|---|
| 0 | 1900-9002-CPV | 1900 | 9002 | Natural | Climatological | Drought | Drought | NaN | NaN | NaN | Cabo Verde | CPV | Western Africa | Africa | Countrywide | NaN | Famine | NaN | NaN | No | No | NaN | NaN | Km2 | NaN | NaN | NaN | NaN | 1900 | NaN | NaN | 1900 | NaN | NaN | 11000.0 | NaN | NaN | NaN | NaN | NaN | NaN | NaN | 3.261389 |
| 1 | 1900-9001-IND | 1900 | 9001 | Natural | Climatological | Drought | Drought | NaN | NaN | NaN | India | IND | Southern Asia | Asia | Bengal | NaN | NaN | NaN | NaN | No | No | NaN | NaN | Km2 | NaN | NaN | NaN | NaN | 1900 | NaN | NaN | 1900 | NaN | NaN | 1250000.0 | NaN | NaN | NaN | NaN | NaN | NaN | NaN | 3.261389 |
| 2 | 1902-0012-GTM | 1902 | 12 | Natural | Geophysical | Earthquake | Ground movement | NaN | NaN | Kill | Guatemala | GTM | Central America | Americas | Quezaltenango, San Marcos | NaN | Tsunami/Tidal wave | NaN | NaN | NaN | NaN | NaN | 8.0 | Richter | 14 | -91 | 20:20 | NaN | 1902 | 4.0 | 18.0 | 1902 | 4.0 | 18.0 | 2000.0 | NaN | NaN | NaN | NaN | NaN | NaN | 25000.0 | 3.391845 |
| 3 | 1902-0003-GTM | 1902 | 3 | Natural | Geophysical | Volcanic activity | Ash fall | NaN | Santa Maria | Kill | Guatemala | GTM | Central America | Americas | NaN | NaN | NaN | NaN | NaN | NaN | NaN | NaN | NaN | NaN | NaN | NaN | NaN | NaN | 1902 | 4.0 | 8.0 | 1902 | 4.0 | 8.0 | 1000.0 | NaN | NaN | NaN | NaN | NaN | NaN | NaN | 3.391845 |
| 4 | 1902-0010-GTM | 1902 | 10 | Natural | Geophysical | Volcanic activity | Ash fall | NaN | Santa Maria | Kill | Guatemala | GTM | Central America | Americas | NaN | NaN | NaN | NaN | NaN | NaN | NaN | NaN | NaN | NaN | NaN | NaN | NaN | NaN | 1902 | 10.0 | 24.0 | 1902 | 10.0 | 24.0 | 6000.0 | NaN | NaN | NaN | NaN | NaN | NaN | NaN | 3.391845 |
Next, I define my plot_disater_type_counts method, which allows me to create a barchart of natural disaster types, simply by specifying the column of the dataframe (df) I want to investigate:
def plot_disaster_type_counts(df, col, min_disaster_count=10):
    # filter our disaster types by counting the number of occurrences of each
    # disaster and then selecting only those that pass our minimum threshold
    disaster_counts = df[col].value_counts()
    filtered_disaster_types = df[df[col].isin(
        disaster_counts[disaster_counts > min_disaster_count].index
    )]

    # initialize our figure and set tick information
    plt.figure(figsize=(20, 9))
    plt.xticks(rotation=90, fontsize=12)

    # plot the disaster types by counting the number of occurrences of each
    # disaster (selecting only those that pass our minimum threshold), ordering
    # the bars in descending order (again, based on count)
    order = disaster_counts[disaster_counts > min_disaster_count].index
    ax = sns.countplot(
        data=filtered_disaster_types,
        x=col,
        order=order,
        palette="cool_r"
    )
    ax.grid(axis="y", alpha=0.5)

    # loop over the patches for each individual bar
    for p in ax.patches:
        # draw the count for the current disaster type
        ax.annotate(
            "{}".format(int(p.get_height())),
            (p.get_x() + (p.get_width() / 2.0), abs(p.get_height())),
            ha="center",
            va="bottom",
            rotation="horizontal",
            color="black",
            xytext=(-3, 5),
            textcoords="offset points"
        )

    # set the axis labels and plot title
    ax.set_xlabel(col)
    ax.set_ylabel("# of {}s".format(col)
    plt.title("Breakdown of {}s".format(col))
    plt.show()
The plot_disaster_type_counts function takes three arguments:
df: The EM-DAT dataset dataframe loaded from diskcol: The particular column of the dataframe we are inspecting, which is assumed to be either Disaster Subgroup, Disaster Type, Disaster Subtype, or Disaster Subsubtypemin_disaster_count: Integer value that allows us to filter out natural disaster types that occur infrequently (also very useful to cleanup our plots)The reason I like this function so much is that it can analyze any disaster type column in the EM-DAT dataset without having to change a single line of code.
The simplicity and utility of this function can be seen below where we (1) define a list of columns we want to analyze, and then (2) loop over them, calling plot_disaster_type_counts on each:
# define the disaster type column names
disaster_col_names = [
    "Disaster Subgroup",
    "Disaster Type",
    "Disaster Subtype",
    "Disaster Subsubtype",
]

# loop over the disaster column names
for col_name in disaster_col_names:
    # plot the disaster type counts for the current column
    plot_disaster_type_counts(df, col_name)
Now, with just a single for loop, we can analyze all four disaster type columns in EM-DAT.
A detailed analysis of each of the four columns is included in the sections below.
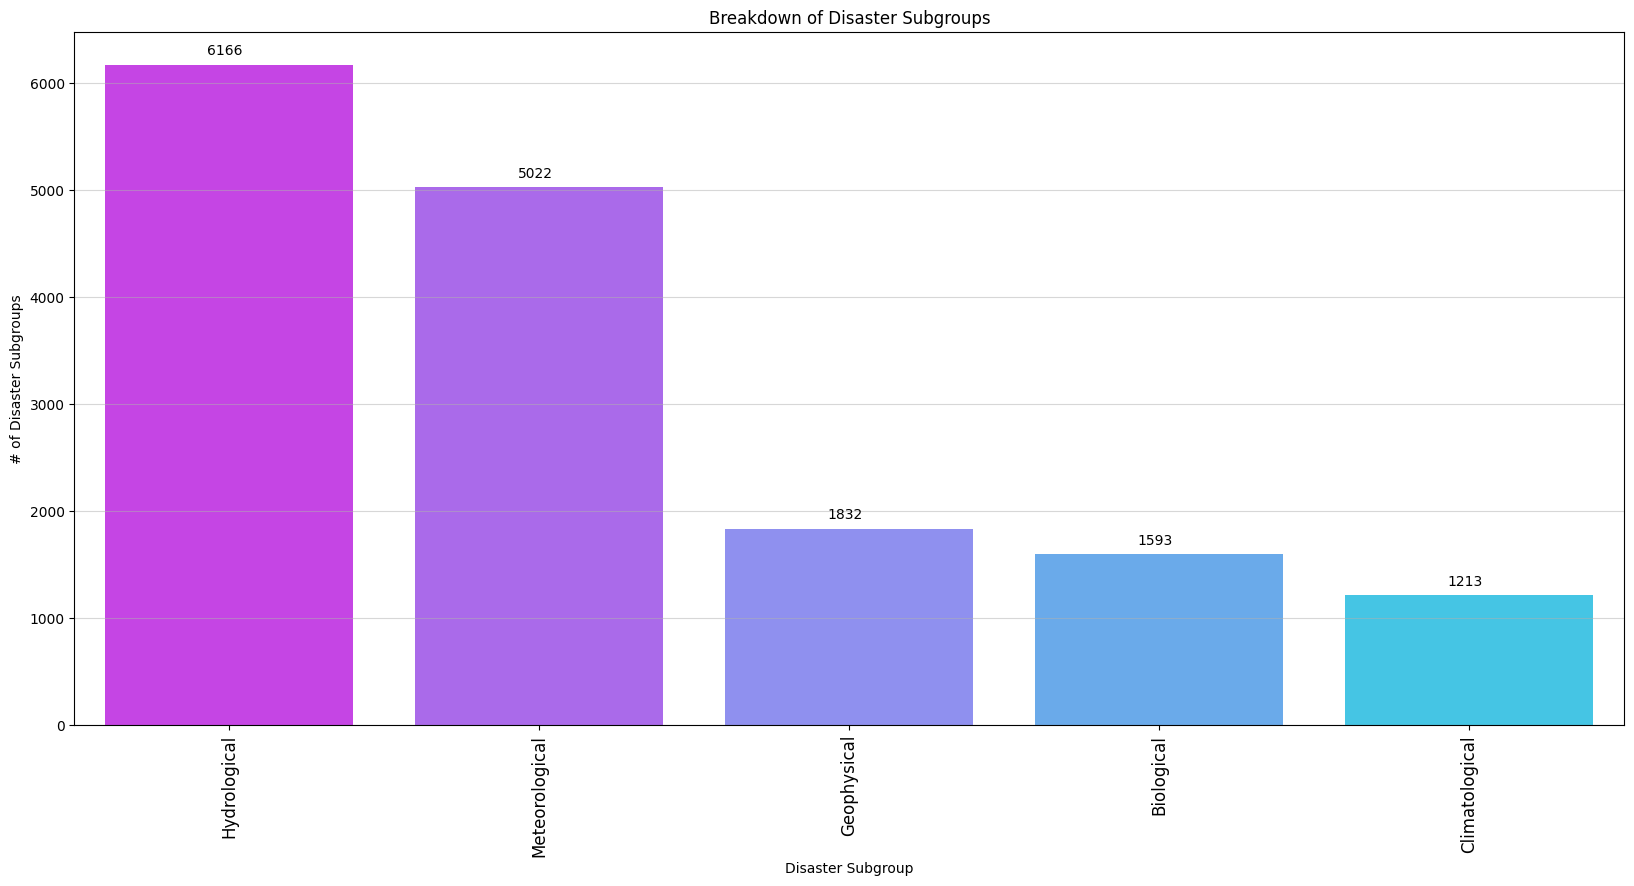
The most represented Disaster Subgroups in EM-DAT include:
Keep in mind that a natural disaster is only included in the EM-DAT database if at least one of the following conditions hold:
Note: More details on natural disaster inclusion in EM-DAT can be found here.
In this context, it makes intuitive sense that hydrological and metrological disasters top the charts.
Flooding is one of the most common, widespread natural disasters, occurring in numerous contexts, from coastal regions affected by storm surges to river valleys, to urban areas with inadequate drainage.
As such, nearly every country in the world is prone to flooding under specific conditions.
Now, let’s consider a geophysical event, such as an earthquake.
Earthquakes occur in many parts of the world, but are only especially frequent and intense in areas near tectonic plate boundaries, including countries such as Japan, Indonesia, and the west coasts of both North and South America.
Since intense earthquakes only happen in specific parts of the world, it makes intuitive sense that earthquakes, as a whole, make up a smaller portion of the EM-DAT dataset (especially when considering the inclusion rules of EM-DAT — only earthquakes that kill or affect a large number of people will be included, by definition).
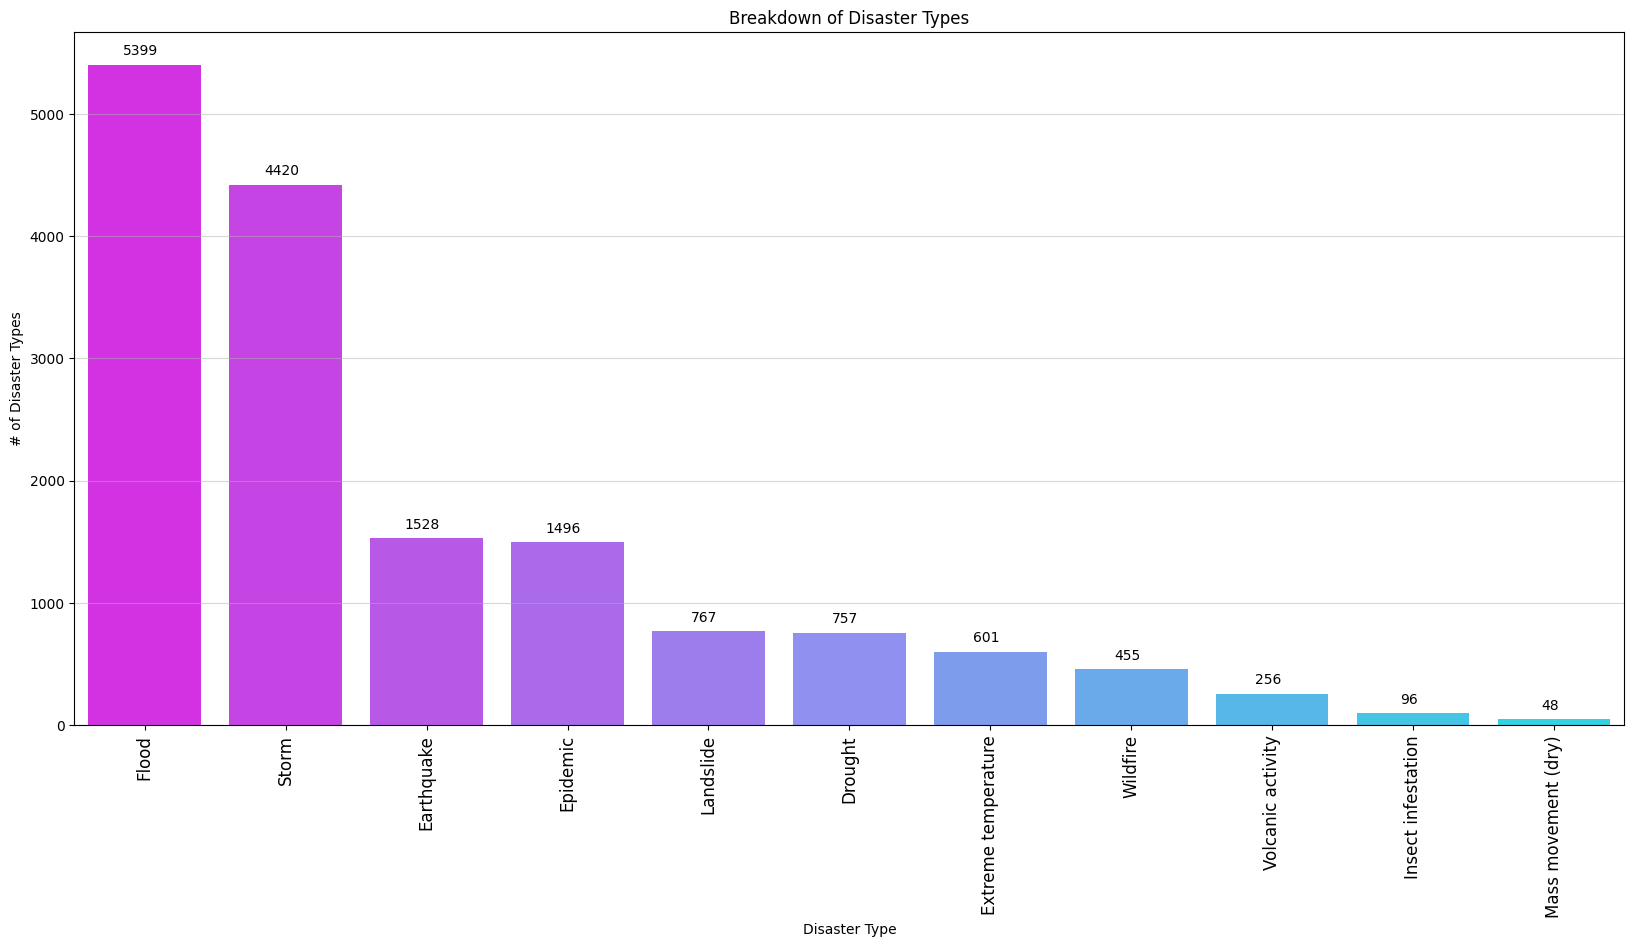
Below is a breakdown of the Disaster Type counts in EM-DAT:
Clearly, it’s evident that floods and storms are the most prevalent Disaster Types. These two significantly outpace the other categories.
Earthquakes, epidemics, and landslides make up the middle range of the plot.
Finally, at the lower end, we have extreme temperature, wildfire, volcanic activity, insect infestation, and mass movements.
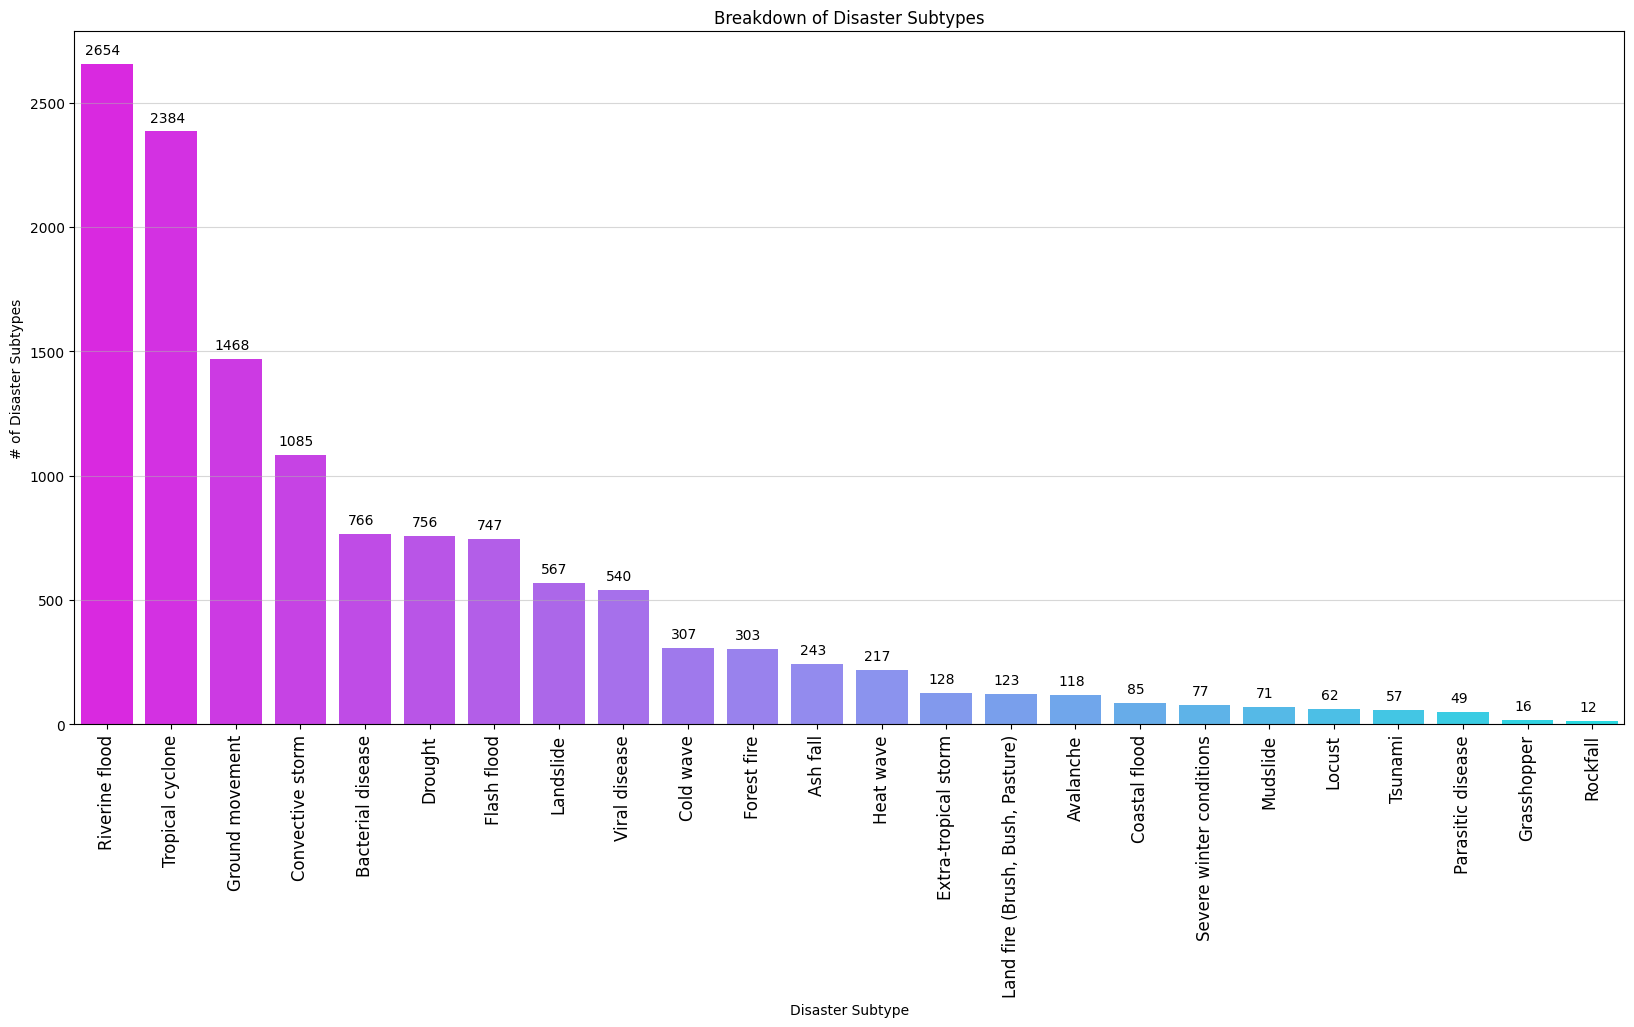
I’ve listed the Disaster Subtypes from EM-DAT below:
Riverine floods, tropical cyclones, and ground movements make up the most prelevant Disaster Subtypes.
On the other end of the spectrum, parasitic disease, grasshopper infestations, and rockfall occur far less frequently in EM-DAT.
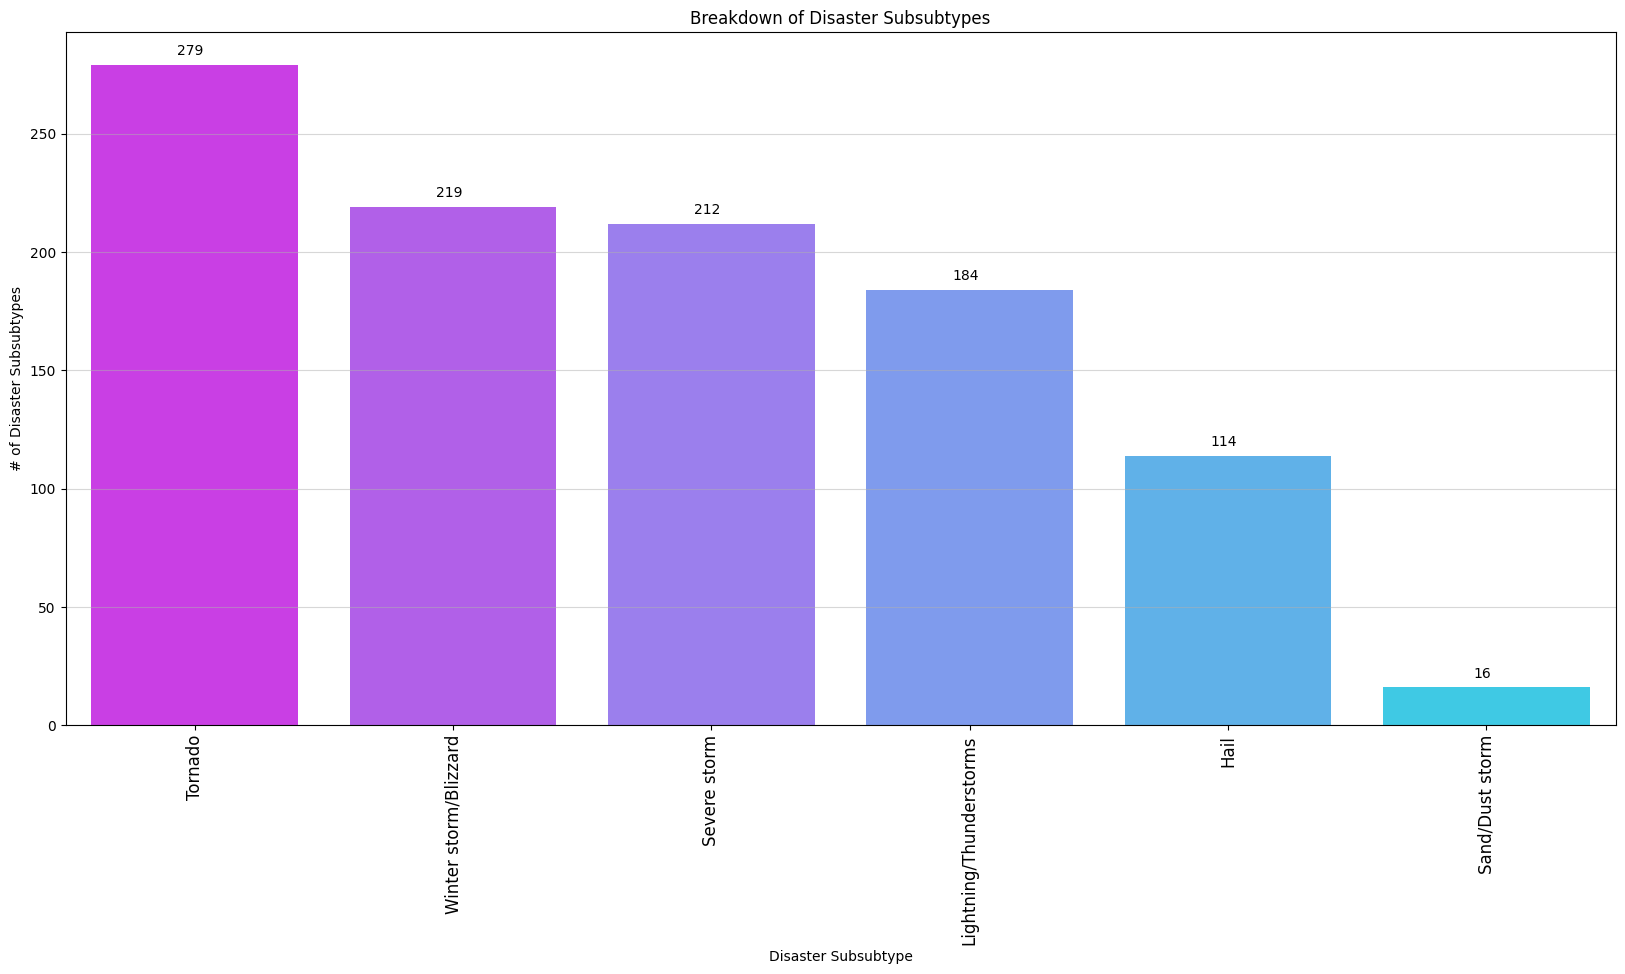
Finally, we have the Disaster Subsubtype column of EM-DAT, the most fine-grained classification of natural disasters in the database.
Here are all Disaster Subsubtypes with a minimum of ten occurrences:
Tornadoes are the most common occurring Disaster Subsubtype, followed by winter storms/blizzards, and severe storms.
We can also see that sand/dust storms are considerably rare compared to the rest of the Disaster Subsubtypes.
Keep in mind that there are less Disaster Subsubtype categorizations than the Disaster Types and Disaster Subtypes because the vast majority of natural disasters do not require such a fine-grained classification.
Instead, most disasters in EM-DAT stop at either the Disaster Type or Disaster Subtype categorization — keep this in mind when performing your own experiments with EM-DAT.
plot_disaster_type_counts function showcased the power and flexibility of Python and Pandas. With minimal code, one can analyze any disaster type column in the dataset, providing a useful tool for future data explorations.Adrian Rosebrock. “Exploring Natural Disaster Types in the EM-DAT Dataset with Python and Pandas”, NaturalDisasters.ai, 2023, https://naturaldisasters.ai/posts/exploring-em-dat-natural-disaster-types/.
@incollection{ARosebrock_NaturalDisasterTypesEMDAT,
    author = {Adrian Rosebrock},
    title = {Exploring Natural Disaster Types in the EM-DAT Dataset with Python and Pandas},
    booktitle = {NaturalDisasters.ai},
    year = {2023},
    url = {https://naturaldisasters.ai/posts/exploring-em-dat-natural-disaster-types/},
}
AI generated content disclaimer: I’ve used a sprinkling of AI magic in this blog post, namely in the “Takeaways” section, where I used AI to create a concise summary of this article. Don’t fret, my human eyeballs have read and edited every word of the AI generated content, so rest assured, what you’re reading is as accurate as I possibly can make it. If there are any discrepancies or inaccuracies in the post, it’s my fault, not that of our machine assistants.
Header photo by Marcus Kauffman on Unsplash
Learn how to plot maps of the world, continents, and countries using Python and GeoPandas.
Quickly understand the EM-DAT dataset hierarchy, and learn how to easily filter natural disaster types using Python and Pandas.
Learn how to get started with the EM-DAT natural disaster database